借助GC日志,实际分析一个问题
主题
借助GC日志,实际分析一个问题
问题
某系统在10点过19秒,触发OOM
分析
堆内存耗尽过程
通过jca.jar分析native_stderr.log,该GC日志表明内存耗尽过程
[Www Mmm dd 09:58:25 yyyy] JVMDUMP039I Processing dump event "allocation", detail "18874384 bytes, type char[]" at yyyy/mm/dd 09:58:26 - please wait. |
从日志上可以看到:
09:58:25需要分配18874384字节,18M09:58:26需要分配37748752字节,36M09:58:28需要分配75497488字节,72M09:58:30需要分配150994960字节,144M09:58:34需要分配301989904字节,288M09:58:43需要分配603979792字节,576M09:58:59需要分配1207959568字节,1.125G
可以看到,每次内存增长是以翻番的形式进行。至此,系统若再要分配内存,需要额外1.125G。
GC统计情况
在GC分析工具中,时间记录统计信息有:
Longest Garbage Collections
20,903 ms (Www Mmm dd 10:00:19 yyyy)
<非同一天,隐去>
6,685 ms  (Www Mmm dd 09:59:02 yyyy)
2,358 ms  (Www Mmm dd 10:00:16 yyyy)
<非同一天,隐去>
Shortest Garbage Collection Intervals
0 ms (Www Mmm dd 09:59:00 yyyy)
0 ms (Www Mmm dd 09:59:02 yyyy)
0 ms (Www Mmm dd 09:59:09 yyyy)
0 ms (Www Mmm dd 09:59:12 yyyy)
0 ms (Www Mmm dd 09:59:14 yyyy)
可见从09:59:00开始,不断进行GC,间隔非常小($0ms$)。耗时也非常厉害:
09:59:02,耗时6.685s10:00:16,耗时2.358s10:00:19,耗时20.903s
说明GC努力回收内存,但仍然无法回收足够多的内存,直至10:00:19内存溢出。
在GC分析工具中,频次统计信息有:
- Number of Java heap exhaustion : 26
- Overall Garbage Collection overhead : 1.55%
- Maximum Garbage Collection overhead : 100% ( Www Mmm dd 09:59:00 yyyy)
- Number of 100% AF overhead : 38
目前看堆内存消耗严重,没有余量支持突发的内存分配。堆内存耗尽26次,100%分配失败发生38次,最大GC将所有内存都分析了一遍。
GC工具论断
在GC分析工具中,论断如下:
List of Java heap failures(Refer to Java Heap Activity Analysis and Recommendations report section for details)
Excessive Garbage Collection detected. 100% of time is spent within Java Garbage Collector  Www Mmm dd 10:00:19 yyyy
<skip 24 times>
Excessive Garbage Collection detected. 100% of time is spent within Java Garbage Collector  Www Mmm dd 10:00:19 yyyy
由此,侧面也可以看到
10:00:19,系统已执行了过多的GC。
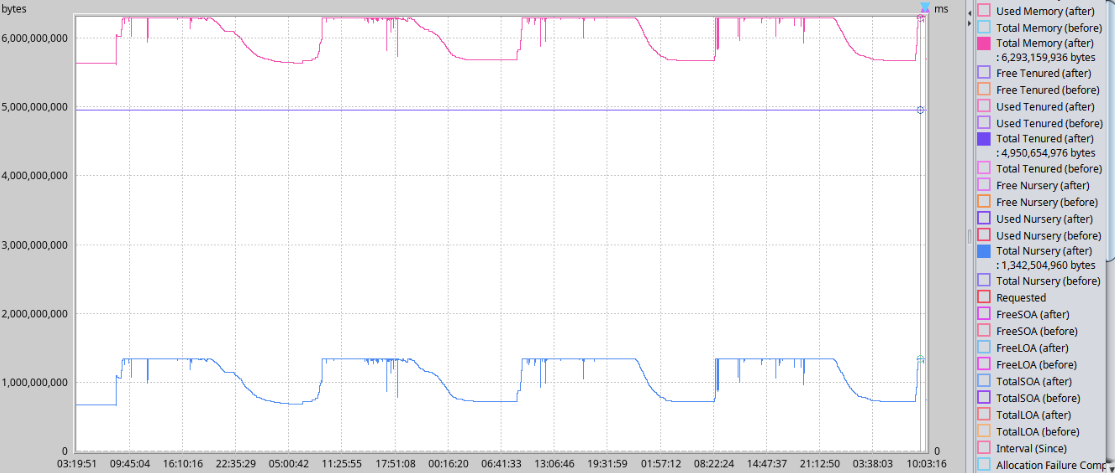
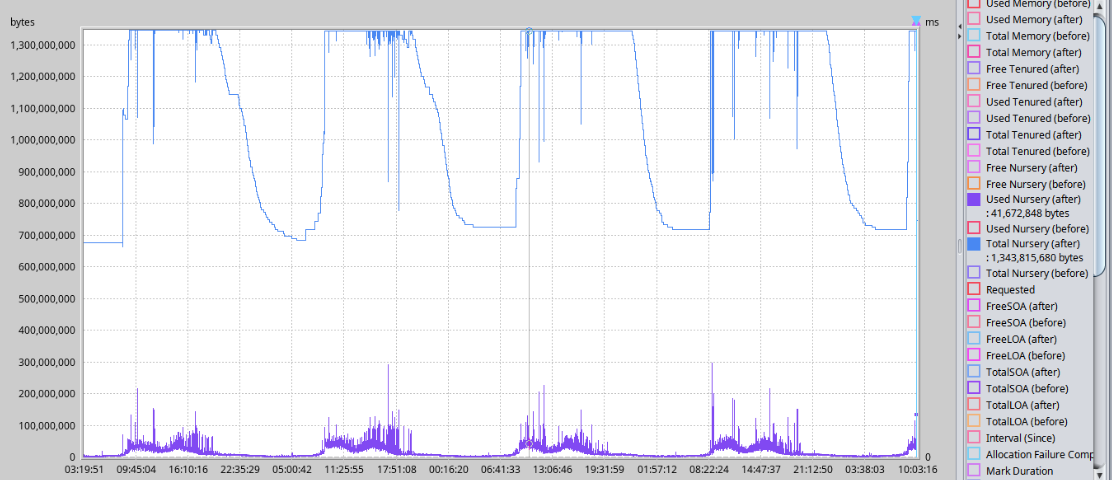
堆内存占用情况
通过观察JVM内存占用,发现可用空间只有新生代的1.5G空间。而新生代中,不能回收的约300M。
全堆内存
新生代内存
新证据
当时的分析,到了这里,没了下文。因为无法定位问题位置。
但是这两天为了为大家讲解native_stderr.log结构,我不借助工具再仔细阅读了当时的native_stderr.log,得到了重要线索:
<allocation-stats totalBytes="1386284392" > |
该线程Thread-63,持有着1G+的内存。这是重点怀疑对象。已转项目组跟进。
结论
工具虽好,但还是要学会自己理解文件内容,自己分析。